import java.util.*;
import org.jfree.chart.*;
import statgraphics.*;
import statgraphics.eda.*;
import static statgraphics.util.Argument.*;
import statgraphics.util.*;
/**
*
* <p>Example: class ScatterPlot.</p>
*/
public class ScatterPlotExample
{
public
static void main(String[] args)
{
PlotFrame[]
pf = new PlotFrame[4];
double xdata[][] = { {2, 5, 1, 3,
4, 1, 5, 3, 4, 2},
{2, 3, 4, 2, 5, 3, 4, 1, 3, 4} };
double[][] ydata = { {50, 57, 41,
54, 54, 38, 63, 48, 59, 46},
{39, 42, 37, 32, 42, 45, 32, 43, 45, 35} };
String[] dataNames =
{"2004", "2005"};
ScatterPlot scatterPlot =
new ScatterPlot(dataNames, "Scatter Diagram",
"Number of Commercials", "Sales", xdata, ydata);
pf[0] =
new PlotFrame("Scatter Plot I", scatterPlot.getPlot(),
500, 270);
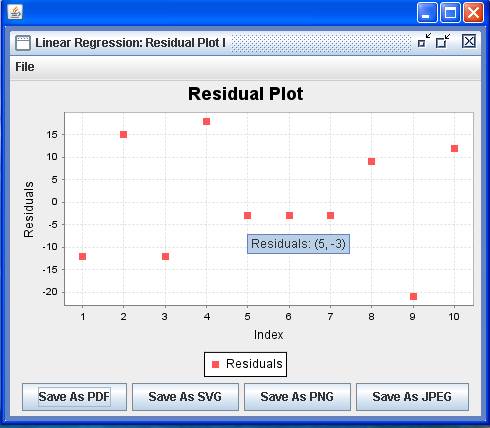
double[] residuals = { -12, 15, -12, 18, -3, -3, -3, 9, -21,
12};
double[] index = {1, 2, 3, 4, 5, 6, 7, 8, 9, 10};
String dataNames2 = "Residuals";
scatterPlot = new ScatterPlot(dataNames2, "Residual Plot",
"Index",
"Residuals", index, residuals);
pf[1] =
new PlotFrame("Linear Regression: Residual Plot
I",
scatterPlot.getPlot(), 500, 270);
Hashtable argument = new Hashtable();
argument.put(DATA_NAMES,
dataNames);
GraphicalAnalysis graphicalAnalysis
=
new ScatterPlot(argument,
xdata, ydata).graphicalAnalysis;
JFreeChart myPlot =
(JFreeChart)
graphicalAnalysis.output.get("PLOT");
pf[2] =
new PlotFrame("Scatter Plot II", myPlot, 500, 270);
argument.put(DATA_NAMES,
dataNames2);
argument.put(TITLE,
"Residual Plot");
argument.put(XLABEL,
"Index");
argument.put(YLABEL,
"Residuals");
graphicalAnalysis = new ScatterPlot(argument, index, residuals).
graphicalAnalysis;
pf[3] =
new PlotFrame("Linear Regression: Residual Plot
II",
graphicalAnalysis.getPlot(), 500, 270);
new PlotFrameFactory().putPlotFrame(pf);
}
}
Results:

See also:
Crosstabulations and Scatter Diagrams