4.1. Crosstabulations and Scatter
Diagrams
The crosstabulation (table) and the
scatter diagram (graph) can help us understand the
relationship between two variables.
1.
Crosstabulations
Example 1:
The following table is the crosstabulation of the quality rating (good, very good and excellent)
and the mean price ($10-19, $20-29, $30-39, and $40-49)
data collected for a sample 300
restaurants located in the
|
Meal Price |
|||||
|
Quality Rating |
$10-19 |
$20-29 |
$30-39 |
$40-49 |
Total |
|
Good |
42 |
40 |
2 |
0 |
84 |
|
Very Good |
34 |
64 |
46 |
6 |
150 |
|
Excellent |
2 |
14 |
28 |
22 |
66 |
|
Total |
78 |
118 |
76 |
28 |
300 |
The above crosstabulation provides
insight abut the relationship between the variables,
quality rating and mean price. It seems
higher meal prices appear to be associated with
the higher quality restaurants and the lower
meal prices appear to be associated with
the lower quality restaurants. For
example, for the most expensive restaurants ($40-49),
none of these restaurants is rated the
lowest quality but most of them are rated highest quality.
On the other hand, for the least
expensive restaurants ($10-19), only 2 of these restaurants
are rated the highest quality ( ) but over half of them are rated lowest quality.
1.
Scatter
Diagram
Suppose we have the following scatter diagrams for two variables x
and y:
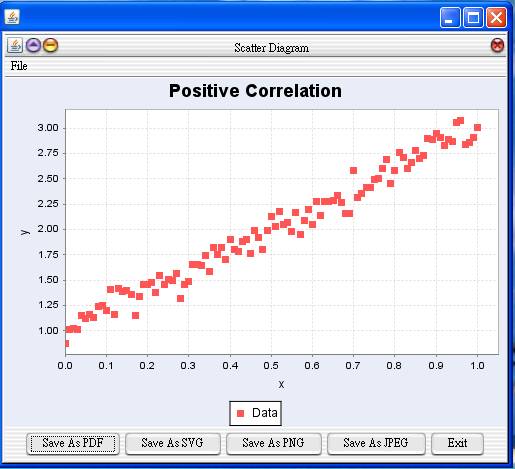
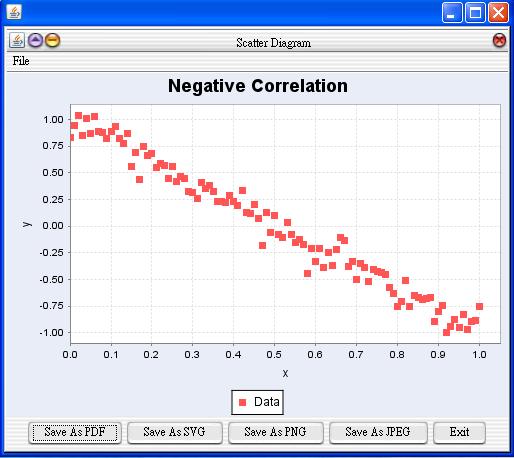
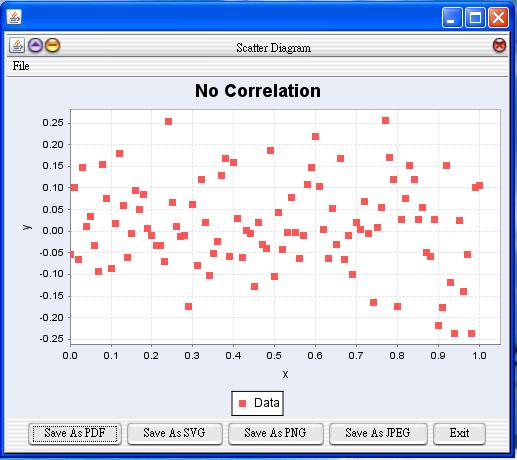
The upper scatter diagram indicates the positive correlation
between x and y
while the middle scatter diagram implies the negative correlation
between the
two variables. The lower scatter diagram shows that
there is no
apparent relationship
between the weight and height.
JavaStatSoft:
Crosstabulations:
Statistics -> Exploratory Data Analysis
-> Association Between Two Categorical Variables
Graphical Display:
Graph -> Scatter Plot