import
java.util.*;
import
org.jfree.chart.*;
import
statgraphics.*;
import
statgraphics.eda.*;
import
static statgraphics.util.Argument.*;
import
statgraphics.util.*;
/**
*
* <p>Example: class
LinePlot.</p>
*/
public
class LinePlotExample
{
public static void
main(String[] args)
{
PlotFrame[] pf = new PlotFrame[8];
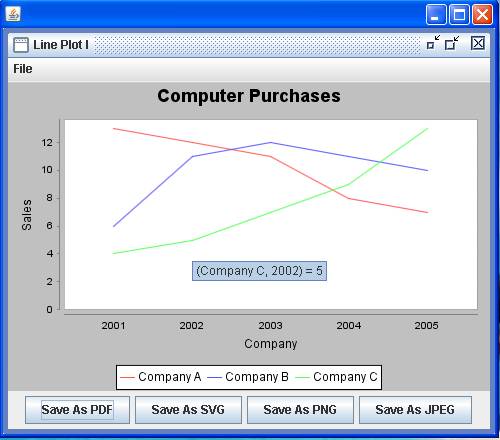
String[] category = {"2001", "2002",
"2003", "2004", "2005"};
double[] data1 = {13, 12, 11, 8, 7};
double[] data2 = {6, 11, 12, 11, 10};
double[] data3 = {4, 5, 7, 9, 13};
String[] dataNames = {"Company A", "Company B",
"Company C"};
LinePlot linePlot = new LinePlot(dataNames, "Computer
Purchases",
"Company", "Sales",
category,
data1, data2, data3);
pf[0] = new PlotFrame("Line Plot I", linePlot.getPlot(), 500,
270);
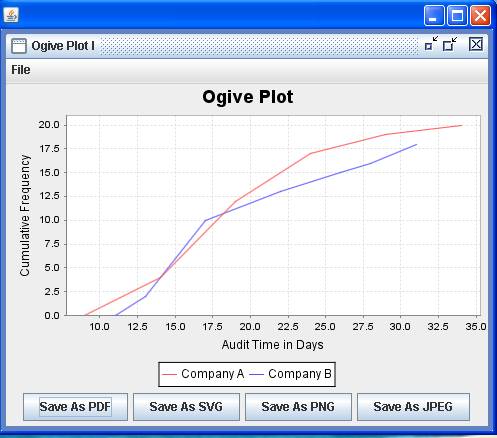
double[][] sortXData = { {9, 14, 19, 24, 29, 34},
{11, 13, 17, 22, 26, 28, 31} };
double[][]
sortYData = { {0, 4, 12, 17, 19, 20},
{0, 2, 10, 13, 15, 16, 18} };
String[] dataNames2 = {"Company A", "Company B"};
linePlot = new LinePlot(dataNames2, "Ogive Plot", "Audit
Time in Days",
"Cumulative
Frequency", sortXData, sortYData);
pf[1] = new PlotFrame("Ogive Plot I", linePlot.getPlot());
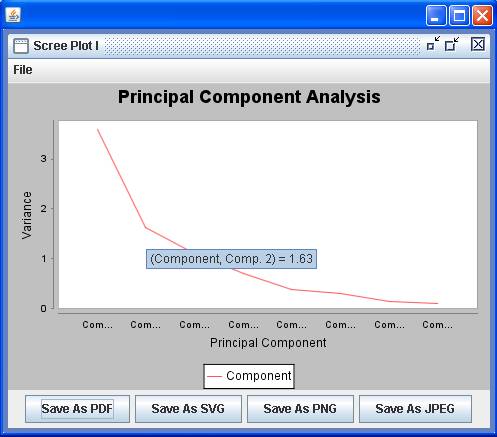
double[] variance = {3.59, 1.63, 1.11, 0.70, 0.38, 0.30, 0.14, 0.11};
String[] componentList = {"Comp. 1", "Comp. 2",
"Comp. 3", "Comp. 4",
"Comp. 5", "Comp. 6", "Comp. 7",
"Comp. 8"};
String dataNames3 = "Component";
linePlot = new LinePlot(dataNames3, "Principal Component
Analysis",
"Principal Component", "Variance",
componentList, variance);
pf[2] = new PlotFrame("Scree Plot I", linePlot.getPlot(), 500,
270);
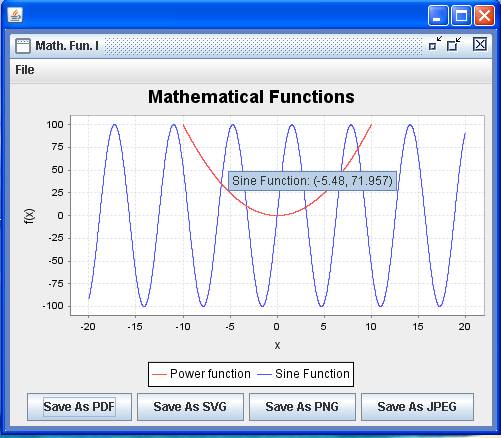
double[][] xData = new double[2][2000];
double[][] yData = new double[2][2000];
String[] dataNames4 = {"Power function", "Sine
Function"};
for
(int j = 0; j < 2; j++)
{
if (j == 0)
{
for (int i = 0; i < 2000; i++)
{
xData[j][i] = -10 + 0.01 * i;
yData[j][i] = Math.pow(xData[j][i], 2.0);
}
}
else
{
for (int i = 0; i < 2000; i++)
{
xData[j][i] = -20 + 0.02 * i;
yData[j][i] = 100 * Math.sin(xData[j][i]);
}
}
}
linePlot = new LinePlot(dataNames4, "Mathematical Functions",
"x",
"f(x)", xData, yData);
pf[3] = new PlotFrame("Math. Fun. I", linePlot.plot);
Hashtable argument1 = new Hashtable();
argument1.put(DATA_NAMES, dataNames);
GraphicalAnalysis graphicalAnalysis = new LinePlot(argument1, category,
data1, data2, data3).graphicalAnalysis;
JFreeChart myPlot = (JFreeChart)
graphicalAnalysis.output.get("PLOT");
pf[4] = new PlotFrame("Line Plot II", myPlot, 500, 270);
Hashtable argument2 = new Hashtable();
argument2.put(DATA_NAMES, dataNames2);
argument2.put(TITLE, "Ogive Plot");
argument2.put(XLABEL, "Audit Time in Days");
argument2.put(YLABEL, "Cumulative Frequency");
graphicalAnalysis = new LinePlot(argument2, sortXData, sortYData).
graphicalAnalysis;
pf[5] = new PlotFrame("Ogive Plot II",
graphicalAnalysis.getPlot(),
500, 270);
Hashtable argument3 = new Hashtable();
argument3.put(DATA_NAMES, dataNames3);
argument3.put(TITLE, "Principal Component Analysis");
argument3.put(XLABEL, "Principal Component");
argument3.put(YLABEL, "Variance");
graphicalAnalysis = new LinePlot(argument3, componentList, variance).
graphicalAnalysis;
pf[6] = new
PlotFrame("Scree Plot II", graphicalAnalysis.getPlot(),
500, 270);
Hashtable argument4 = new Hashtable();
argument4.put(DATA_NAMES, dataNames4);
argument4.put(TITLE, "Mathematical Functions");
argument4.put(XLABEL, "x");
argument4.put(YLABEL, "f(x)");
graphicalAnalysis = new LinePlot(argument4, xData, yData).
graphicalAnalysis;
pf[7] = new PlotFrame("Math. Fun. II",
graphicalAnalysis.plot);
new
PlotFrameFactory().putPlotFrame(pf);
}
}
Results:
See also: