import
java.util.*;
import
org.jfree.chart.*;
import
statgraphics.*;
import
statgraphics.eda.*;
import
static statgraphics.util.Argument.*;
import
statgraphics.util.*;
/**
*
* <p>Example: class
Histogram.</p>
*/
public
class HistogramExample
{
public static void
main(String[] args)
{
double[][] data = { {12, 14, 19, 18, 15, 15, 18, 17, 20, 27, 22, 23, 22,
21, 33, 28, 14, 18, 16, 13},
{4, 2, 3, 2, 6, 9, 2, 5, 6, 6, 12, 2, 11, 9, 6, 9,
8, 9, 2, 7} };
String[] dataNames = {"2004", "2005"};
PlotFrame[] pf = new PlotFrame[8];
pf[0] = new PlotFrame("Histogram I",
new Histogram(
dataNames, 5, "Relative Frequency", "Histogram
(R.F.)",
"Sales",
"R. F.", data).plot, 500, 270);
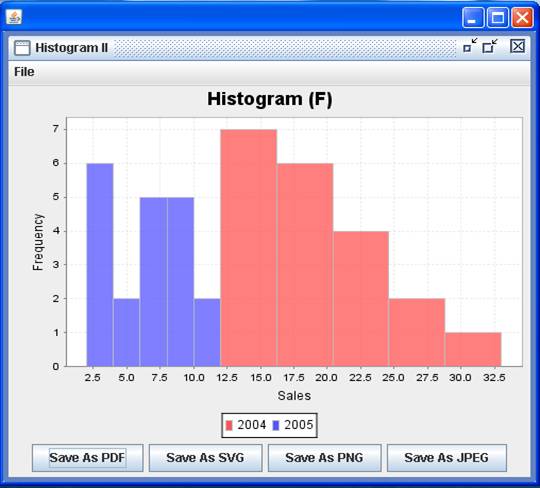
pf[1] = new PlotFrame("Histogram II",
new Histogram(dataNames, 5, "Histogram (F)",
"Sales", "Frequency", data).
getPlot(),
500, 270);
pf[2] = new PlotFrame("Histogram III",
new Histogram(dataNames, 5, data).plot,
500, 270);
pf[3] = new PlotFrame("Histogram IV",
new Histogram(dataNames, data).getPlot(),
500, 270);
Hashtable argument1 = new Hashtable();
argument1.put(DATA_NAMES, dataNames);
argument1.put(BIN_NUMBER, 5);
argument1.put(FREQUENCY_CHOICE, "Relative Frequency");
argument1.put(TITLE,
"Histogram (R.F.)");
argument1.put(XLABEL, "Sales");
argument1.put(YLABEL, "R. F.");
pf[4] = new PlotFrame("Histogram V",
new Histogram(argument1, data).
graphicalAnalysis.plot,
500, 270);
argument1.remove(FREQUENCY_CHOICE);
argument1.put(YLABEL, "Frequency");
argument1.put(TITLE, "Histogram (Frequency)");
pf[5] = new PlotFrame("Histogram VI",
new Histogram(argument1, data).
graphicalAnalysis.getPlot(),
500, 270);
Hashtable argument2 = new Hashtable();
argument2.put(DATA_NAMES, dataNames);
argument2.put(BIN_NUMBER, 5);
GraphicalAnalysis graphicalAnalysis =
new Histogram(argument2,
data).
graphicalAnalysis;
JFreeChart myPlot =
(JFreeChart)
graphicalAnalysis.output.get("PLOT");
pf[6] = new PlotFrame("Histogram VII", myPlot, 500, 270);
Hashtable argument3 = new Hashtable();
argument3.put(DATA_NAMES, dataNames);
pf[7] = new PlotFrame("Histogram VIII",
new Histogram(argument3, data).
graphicalAnalysis.getPlot(),
500, 270);
new
PlotFrameFactory().putPlotFrame(pf);
}
}
Results:

See also: