import
java.util.*;
import
org.jfree.chart.*;
import
statgraphics.*;
import
statgraphics.eda.*;
import
static statgraphics.util.Argument.*;
import
statgraphics.util.*;
/**
*
* <p>Example: class CombinedLineBarPlot.</p>
*/
public
class CombinedLineBarPlotExample
{
public static void
main(String[] args)
{
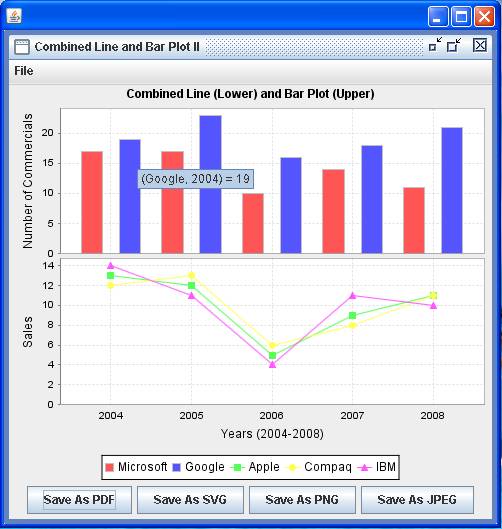
String[] category = {"2004", "2005",
"2006", "2007", "2008"};
String[] lineDataNames = {"Apple", "Compaq",
"IBM"};
String[] barDataNames = {"Microsoft", "Google"};
double[][] lineData = { {13, 12, 5, 9, 11}, {12, 13, 6, 8, 11},
{14, 11, 4, 11, 10} };
double[][] barData = { {17, 17, 10, 14, 11}, {19, 23, 16, 18, 21} };
PlotFrame[] pf = new PlotFrame[4];
pf[0] = new PlotFrame(
"Combined Line and
Bar Plot I",
new CombinedLineBarPlot(
lineDataNames, barDataNames,
"Combined Line (Upper) and Bar Plot (Lower)",
"Years (2004-2008)",
"Sales", "Number of Commercials",
category, lineData, barData).getPlot(), 500, 270);
pf[1] = new PlotFrame(
"Combined Line and
Bar Plot II",
new CombinedLineBarPlot(false,
lineDataNames,
barDataNames,
"Combined Line (Lower) and Bar Plot (Upper)",
"Years (2004-2008)", "Sales", "Number of
Commercials",
category, lineData, barData).getPlot(), 500, 270);
Hashtable argument1 = new Hashtable();
argument1.put(TITLE, "Combined Line and Bar Plot");
argument1.put(XLABEL, "Years (2004-2008)");
argument1.put(YLABEL,
new
String[]{"Sales", "Number of Commercials"});
argument1.put(DATA_NAMES,
new String[][]{lineDataNames,
barDataNames});
pf[2] = new PlotFrame(
"Combined Line and
Bar Plot III",
new CombinedLineBarPlot(argument1, category,
lineData, barData).graphicalAnalysis.getPlot(), 500, 270);
argument1.put(YLABEL, new String[]{"Sales",
"Sales"});
argument1.put(DATA_NAMES,
new
String[][]{lineDataNames, lineDataNames});
argument1.put(IS_LINE_PLOT_UPPER, false);
GraphicalAnalysis graphicalAnalysis = new CombinedLineBarPlot(
argument1, category, lineData, lineData).graphicalAnalysis;
JFreeChart myPlot =
(JFreeChart)
graphicalAnalysis.output.get("PLOT");
pf[3] = new PlotFrame("Combined Line and Bar Plot IV",
myPlot, 500, 270);
new
PlotFrameFactory().putPlotFrame(pf);
}
}
Results:

See also: