2.1. Summarizing Qualitative Data
For qualitative data, we
can use frequency distribution and relative frequency. We now introduce
frequency distribution, relative
frequency and percent frequency.
Frequency distribution:
tabular summary of data indicating the number of data values in each of
several nonoverlapping classes.
Relative frequency: (frequency
of a class)/n, where n is the total number of the data.
Percent frequency: (relative
frequency)× 100%.
Based
on the frequency distribution, relative frequency, and percent frequency of the
data, we can
use table and graphs to display these frequencies.
Example 1:
Forbes
investigates the degrees of 25 best paid CEO (chief executive officer).
Tabular summary:
|
Degrees |
Frequency |
Relative
Frequency |
Percent
Frequency |
|
None |
2 |
0.08 |
8 |
|
Bachelor |
11 |
0.44 |
44 |
|
Master |
7 |
0.28 |
28 |
|
Doctorate |
5 |
0.20 |
20 |
|
Total |
25 |
1.00 |
100 |
Graphical display:
Bar
Graph:
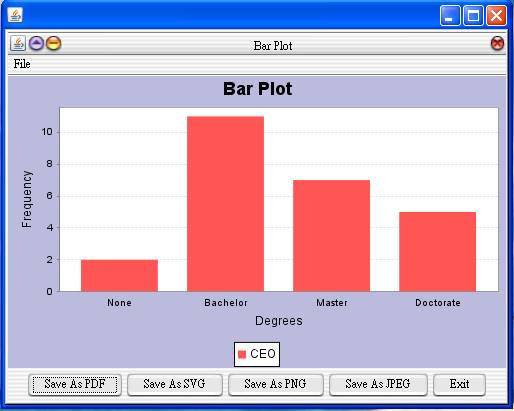
Pie Graph:
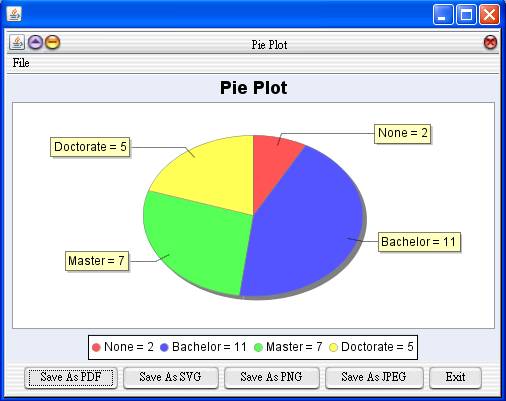
JavaStatSoft:
Data summary:
Statistics -> Exploratory Data Analysis
-> Qualitative Data
Graphical Display:
Graph -> Exploratory Data Analysis ->
Qualitative Data -> Bar Plot
Graph -> Exploratory Data Analysis ->
Qualitative Data -> Pie Plot
Graph ->
Exploratory Data Analysis -> Qualitative Data -> Combined Plot (Bar and
Line)