import
java.util.*;
import
org.jfree.chart.*;
import
statgraphics.*;
import
statgraphics.eda.*;
import
static statgraphics.util.Argument.*;
import
statgraphics.util.*;
/**
*
* <p>Example: class
BoxPlot.</p>
*/
public
class BoxPlotExample
{
public static void
main(String[] args)
{
double[][] data = new double[12][20];
for
(int i = 0; i < 12; i++)
{
for (int j = 0; j < 20; j++)
{
data[i][j] = -10 + Math.random() * 20.0;
}
}
PlotFrame[] pf = new PlotFrame[8];
String[] dataNames = {"A", "B", "C",
"D", "E", "F", "G", "H",
"I",
"J",
"K", "L"};
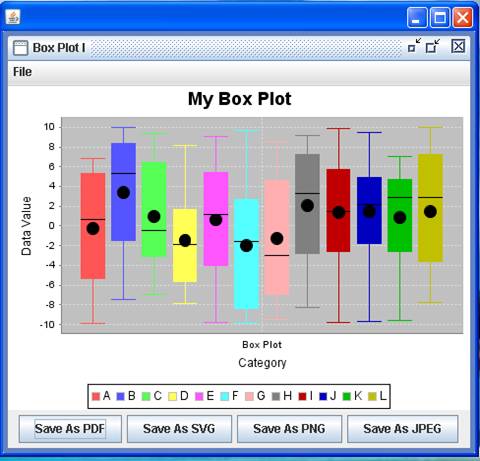
pf[0] = new PlotFrame("Box Plot I",
new
BoxPlot(dataNames, "My Box Plot",
"Category", "Data Value", data).
getPlot(), 500, 270);
pf[1] = new PlotFrame("Box Plot II",
new BoxPlot(dataNames,
data).plot,
500,
270);
Date[] time = new Date[12];
for
(int i = 0; i < 12; i++)
{
time[i] = new Date(105, i - 1, 21);
}
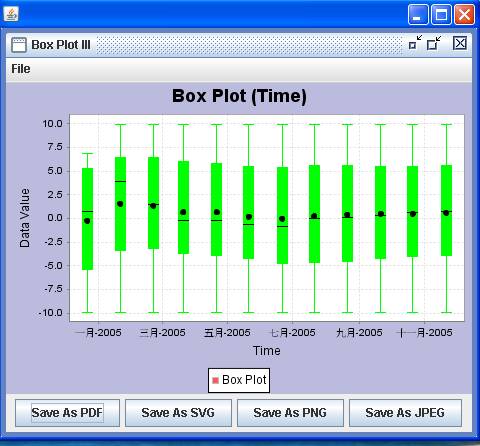
pf[2] = new PlotFrame("Box Plot III",
new BoxPlot("Box Plot (Time)", "Time",
"Data Value", time, data).getPlot(),
500, 270);
pf[3] = new PlotFrame("Box Plot IV",
new BoxPlot(time,
data).getPlot(),
500, 270);
Hashtable argument1 = new Hashtable();
argument1.put(DATA_NAMES, dataNames);
argument1.put(TITLE, "My Box Plot");
argument1.put(XLABEL, "Category");
argument1.put(YLABEL, "Data Value");
pf[4] = new PlotFrame("Box Plot V",
new BoxPlot(argument1,
data).graphicalAnalysis.getPlot(),
500, 270);
Hashtable argument2 = new Hashtable();
argument2.put(DATA_NAMES, dataNames);
pf[5] = new PlotFrame("Box Plot VI",
new
BoxPlot(argument2, data).
graphicalAnalysis.plot,
500, 270);
Hashtable argument3 = new Hashtable();
argument3.put(TITLE, "Box Plot (Time)");
argument3.put(XLABEL, "Category");
argument3.put(YLABEL, "Data Value");
GraphicalAnalysis graphicalAnalysis =
new BoxPlot(argument3, time, data).graphicalAnalysis;
JFreeChart myPlot =
(JFreeChart)
graphicalAnalysis.output.get("PLOT");
pf[6] = new PlotFrame("Box Plot VII", myPlot, 500, 270);
Hashtable argument4 = new Hashtable();
pf[7] = new PlotFrame("Box Plot VIII",
new BoxPlot(argument4, time, data).
graphicalAnalysis.plot, 500, 270);
new
PlotFrameFactory().putPlotFrame(pf);
}
}
Results:
See also: