3.3. Exploratory Data Analysis
1. Five-Number Summary:
The
five number summary can provide important information about both the location and
the
dispersion
of the data. They are:
Smallest value
First quartile
Median
Third quartile
Largest value
Example 2 (continue):
The original data (in hours) are:
Factory
1: 10.1, 9.9, 10.1, 9.9, 9.9, 10.1, 9.9, 10.1, 9.9, 10.1
Factory
2: 16, 5, 7, 14, 6, 15, 3, 13, 9, 12.
The
five-number summary for the data from both factories is
|
|
Smallest |
|
Median |
|
Largest |
|
Factory 1 |
9.9 |
9.9 |
10 |
10.1 |
10.1 |
|
Factory 2 |
3 |
6 |
10.5 |
14 |
16 |


2. Box Plot:
The
box-plot is commonly used graphical method to provide information about both
the location
and
dispersion of the data. Especially, as the interest is the comparison of the
data from different
populations,
the box-plot can provide insight. The box-plot is
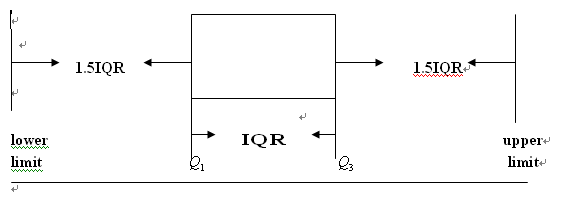
Note: data outside upper
limit and lower limit are called outliers.
JavaStatSoft:
Data summary:
Statistics -> Exploratory Data Analysis
-> Quantitative Data