import
java.util.*;
import
org.jfree.chart.*;
import
statgraphics.*;
import
statgraphics.eda.*;
import
static statgraphics.util.Argument.*;
import
statgraphics.util.*;
/**
*
* <p>Example: class
BarPlot.</p>
*/
public
class BarPlotExample
{
public static void
main(String[] args)
{
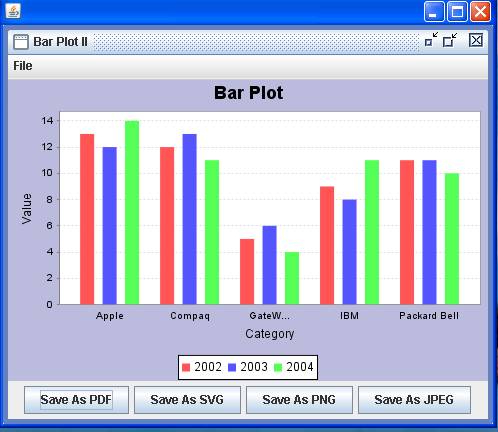
String[] category = {"Apple", "Compaq",
"GateWay 2000", "IBM",
"Packard Bell"};
double[][] data = { {13, 12, 5, 9, 11}, {12, 13, 6, 8, 11},
{14, 11, 4, 11, 10} };
String[] dataNames = {"2002", "2003",
"2004"};
PlotFrame[] pf = new PlotFrame[4];
pf[0] = new PlotFrame("Bar Plot I",
new BarPlot("3D", dataNames, "Bar Plot A",
"Company",
"Frequency",
category, data).getPlot(), 500, 270);
pf[1] = new PlotFrame("Bar Plot II",
new BarPlot("2D", dataNames, category, data).
getPlot(),
500, 270);
Hashtable argument1 = new Hashtable();
argument1.put(TITLE, "Bar Plot B");
argument1.put(XLABEL, "Company");
argument1.put(YLABEL, "Frequency");
argument1.put(DATA_NAMES, dataNames);
argument1.put(OPTION,
"3D");
pf[2] = new PlotFrame("Bar Plot III",
new BarPlot(argument1, category, data).
graphicalAnalysis.getPlot(), 500, 270);
Hashtable argument2 = new Hashtable();
argument2.put(DATA_NAMES, dataNames);
argument2.put(OPTION, "2D");
GraphicalAnalysis graphicalAnalysis =
new BarPlot(argument2,
category,
data).graphicalAnalysis;
JFreeChart myPlot =
(JFreeChart) graphicalAnalysis.output.get("PLOT");
pf[3] = new PlotFrame("Bar Plot IV", myPlot, 500, 270);
new
PlotFrameFactory().putPlotFrame(pf);
}
}
Results:

See also: