import statgraphics.eda.ScatterPlot;
import statgraphics.util.*;
/**
*
* <p>Example: class ScatterPlot.</p>
*/
pf = new PlotFrame[2];
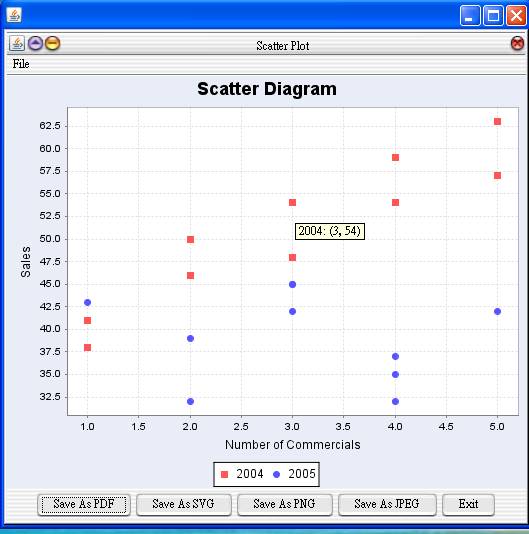
double[][] xdata = { {2, 5, 1, 3, 4, 1, 5, 3, 4,
2},
{2, 3, 4, 2, 5, 3, 4, 1, 3, 4} };
double[][] ydata = { {50, 57, 41, 54, 54, 38, 63,
48, 59, 46},
{39, 42, 37, 32, 42, 45, 32, 43, 45, 35} };
String[] dataNames = {"2004",
"2005"};
ScatterPlot scatterPlot = new ScatterPlot(
dataNames, "Scatter
Diagram", "Number of Commercials",
"Sales", xdata, ydata);
pf[0] = new PlotFrame("Scatter
Plot", scatterPlot.getPlot(), 500, 270);
double[] residuals = { -12, 15, -12, 18, -3, -3, -3, 9, -21, 12};
double[] index = {1, 2, 3, 4, 5, 6, 7, 8, 9, 10};
String
dataNames2 = "Residuals";
scatterPlot = new ScatterPlot(dataNames2,
"Residual Plot", "Index",
"Residuals", index, residuals);
pf[1] = new PlotFrame("Linear
Regression: Residual Plot",
scatterPlot.getPlot(), 500, 270);
new PlotFrameFactory().putPlotFrame(pf);
Results:
 \
\
See also: