import statgraphics.eda.PiePlot;
import statgraphics.util.*;
/**
*
* <p>Example: class PiePlot.</p>
*/
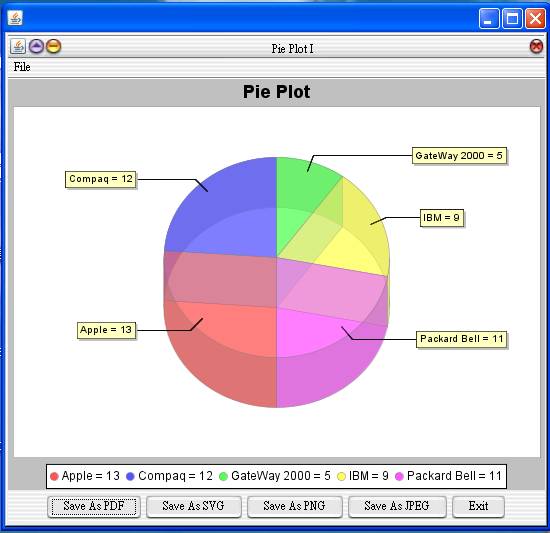
String[] category = {"Apple", "Compaq", "GateWay 2000", "IBM",
"Packard Bell"};
double[] data = {13, 12, 5, 9, 11};
pf = new PlotFrame[2];
pf[0] = new PlotFrame("Pie Plot I",
new PiePlot("3D",
category, data).plot, 500, 270);
pf[1] = new PlotFrame("Pie Plot
II",
new PiePlot(category,
data).getPlot(), 500, 270);
new PlotFrameFactory().putPlotFrame(pf);
Results:

See also: