import statgraphics.eda.CombinedLineBarPlot;
import statgraphics.util.*;
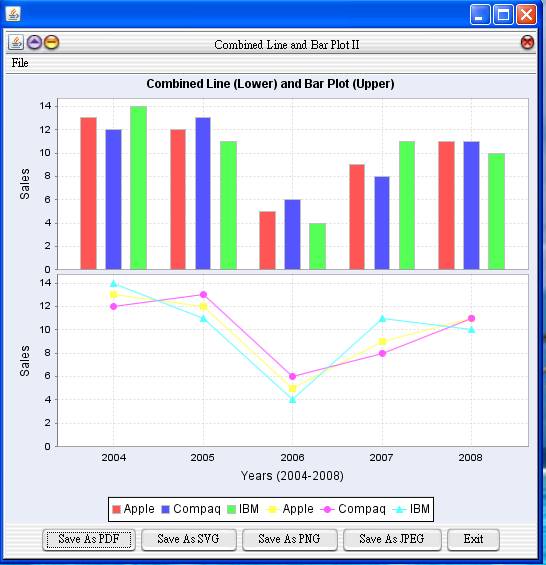
String[]
category = {"2004", "2005", "2006",
"2007", "2008"};
String[] lineDataNames = {"Apple",
"Compaq", "IBM"};
String[] barDataNames = {"Microsoft",
"Google"};
double[][] lineData = { {13, 12, 5, 9, 11}, {12,
13, 6, 8, 11},
{14, 11, 4, 11, 10} };
double[][] barData = { {17, 17, 10, 14, 11}, {19,
23, 16, 18, 21} };
pf = new PlotFrame[2];
pf[0] = new PlotFrame("Combined Line and Bar Plot I",
new CombinedLineBarPlot(
lineDataNames, barDataNames,
"Combined
Line (Upper) and Bar Plot (Lower)",
"Years (2004-2008)",
"Sales", "Number of Commercials",
category, lineData, barData).getPlot(),
500, 270);
pf[1] = new PlotFrame("Combined Line and Bar Plot II",
new CombinedLineBarPlot(
false,
lineDataNames, lineDataNames,
"Combined
Line (Lower) and Bar Plot (Upper)",
"Years (2004-2008)",
"Sales", "Sales",
category, lineData, lineData).getPlot(),
500, 270);
new PlotFrameFactory().putPlotFrame(pf);
Results:

See also: