import
statgraphics.eda.BarPlot;
import
statgraphics.util.*;
String[]
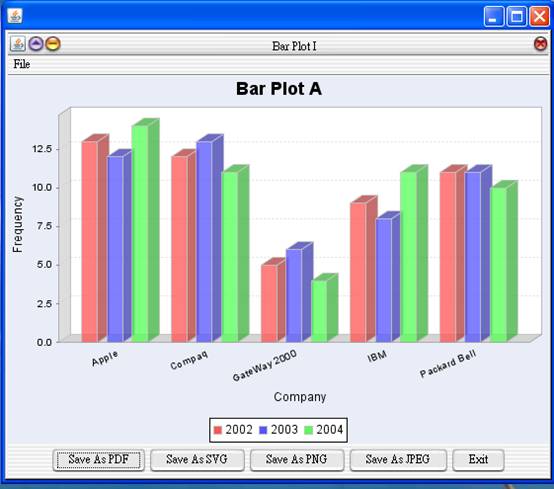
category = {"Apple", "Compaq", "GateWay 2000",
"IBM",
"Packard Bell"};
double[][]
data = { {13, 12, 5, 9, 11}, {12, 13, 6, 8, 11},
{14, 11, 4, 11, 10} };
String[]
dataNames = {"2002", "2003", "2004"};
pf =
new PlotFrame[2];
pf[0]
= new PlotFrame("Bar Plot I",
new BarPlot("3D", dataNames, "Bar Plot A",
"Company", "Frequency", category, data).getPlot(),
500, 270);
pf[1]
= new PlotFrame("Bar Plot II",
new BarPlot("2D", dataNames, category, data).
getPlot(), 500, 270);
new
PlotFrameFactory().putPlotFrame(pf);
Results:

See also: