9.7. Tests about a Population Proportion
The general setting is the following:
 : the population proportion ;
 : the particular hypothesized value
The
statistical description for a testing problem is
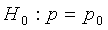 vs.
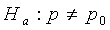
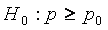 vs.
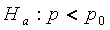 ,
and
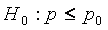 vs.
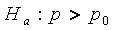 .
General
Procedure: Large Sample Case ( ) and
level of significance 
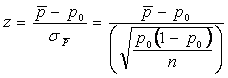 .
(I): vs. ,
Then,
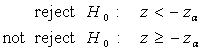
In addition,

(II):
vs. .
Then,
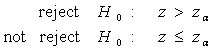
In addition,

(III):
vs.
Then,
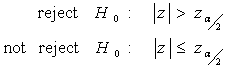
In addition,

Example 6:
An official
of a large national union claims that the fraction of women in the union
is
not significant different from 0.5,
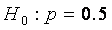 vs.
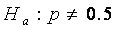 .
Using
the sample information reported below,
|
Sample size |
400 |
|
Women |
168 |
|
Men |
232 |
(a) Test the
hypothesis at 5% level of significance using a critical value (classical
approach).
(b)
Test the hypothesis at 10% level of significance using a p-value.
(c)
Using a confidence interval, test the hypothesis at the
5% level of significance.
[solutions:]
 .
(a)  ,
 .
(b)  ,

(c) A 95% confidence interval for is

Since  , we reject
 .
JavaStatSoft:
Z
test:
Statistics
-> Tests -> One Sample -> Proportion and Count