import java.util.*;
import org.jfree.chart.*;
import statgraphics.*;
import statgraphics.eda.*;
import static statgraphics.util.Argument.*;
import statgraphics.util.*;
/**
*
* <p>Example: class TimeSeriesPlot.</p>
*/
public class TimeSeriesPlotExample
{
public
static void main(String[] args)
{
int[][][]
time = new int[2][12][6];
double[][] data = new double[2][12];
String[] dataNames =
{"Company A", "Company B"};
PlotFrame[]
pf = new PlotFrame[4];
for (int j = 0; j < 2; j++)
{
for (int i = 0; i < 12; i++)
{
time[j][i][0] = 0;
time[j][i][1] = 0;
time[j][i][2] = 0;
time[j][i][3] = 1;
time[j][i][4] = i + 1;
time[j][i][5] = 2005;
data[j][i] = 100 + Math.random() * 20.0;
}
}
pf[0] =
new PlotFrame(
"Time Series Plot
I",
new TimeSeriesPlot(dataNames, "Time Series Plot",
"Date", "Stock Price", time, data).plot, 500, 270);
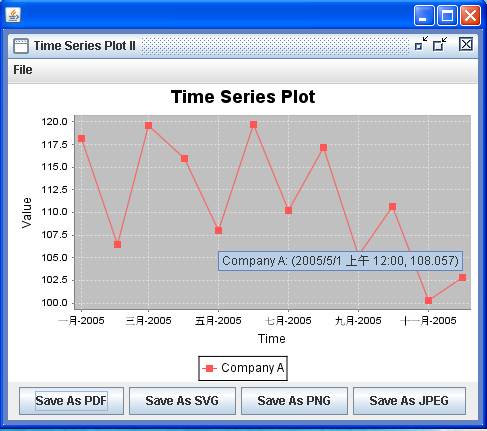
pf[1] =
new PlotFrame("Time Series Plot II", new TimeSeriesPlot(
dataNames[0], time[1],
data[0]).plot, 500, 270);
Hashtable argument = new Hashtable();
argument.put(DATA_NAMES,
dataNames);
GraphicalAnalysis graphicalAnalysis
=
new TimeSeriesPlot(argument,
time, data).graphicalAnalysis;
JFreeChart myPlot =
(JFreeChart)
graphicalAnalysis.output.get("PLOT");
pf[2] =
new PlotFrame("Time Series Plot III", myPlot, 500, 270);
argument.put(DATA_NAMES,
dataNames[0]);
argument.put(TITLE,
"Time Series Plot");
argument.put(XLABEL,
"Date");
argument.put(YLABEL,
"Stock Price");
pf[3] =
new PlotFrame("Time Series Plot IV",
new TimeSeriesPlot(argument,
time[0], data[1]).
graphicalAnalysis.getPlot(), 500, 270);
new PlotFrameFactory().putPlotFrame(pf);
}
}
Results: