import java.util.*;
import org.jfree.chart.*;
import statgraphics.*;
import statgraphics.survival.*;
import static statgraphics.util.Argument.*;
import statgraphics.util.*;
/**
*
* <p>Example: class SurvivalEstimatePlot.</p>
*/
public class SurvivalEstimatePlotExample
{
public
static void main(String[] args)
{
double[] sortedTime1 = {59, 115, 156, 268, 329, 353, 365,
431, 464, 475,
563, 638, 700};
double[] sortedTime2 = {76, 105, 144, 201, 254, 315, 447,
527, 655};
double[] sortedSurvivalEstimate1 =
{0.9615, 0.9231, 0.8846,
0.8462, 0.8077, 0.7692, 0.7308, 0.6878,
0.6419, 0.5961, 0.5464,
0.4967, 0.4967};
double[] sortedSurvivalEstimate2 =
{0.8812, 0.8234, 0.7689,
0.6612, 0.5644, 0.5034, 0.3416, 0.3001,
0.2219};
String[] names = new String[] {"Treatment",
"Control"};
PlotFrame[]
pf = new PlotFrame[4];
pf[0] =
new PlotFrame(
"Kaplan-Meier
Estimate Plot I",
new SurvivalEstimatePlot(names[0],
sortedTime1,
sortedSurvivalEstimate1).getPlot(),
500, 270);
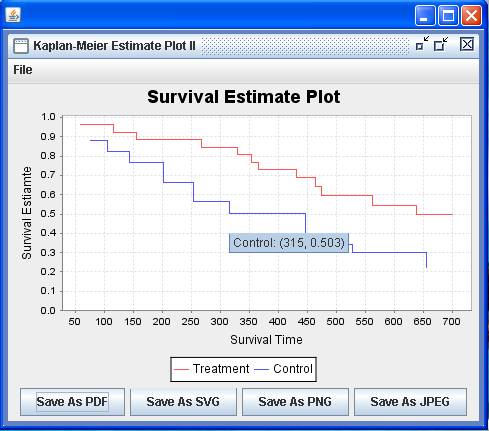
pf[1] =
new PlotFrame(
"Kaplan-Meier
Estimate Plot II",
new SurvivalEstimatePlot(names,
new double[][] {sortedTime1, sortedTime2},
new double[][] {sortedSurvivalEstimate1,
sortedSurvivalEstimate2}).plot, 500, 270);
Hashtable argument = new Hashtable();
argument.put(DATA_NAMES,
names[0]);
GraphicalAnalysis graphicalAnalysis
=
new SurvivalEstimatePlot(argument,
sortedTime1,
sortedSurvivalEstimate1).graphicalAnalysis;
JFreeChart myPlot =
(JFreeChart)
graphicalAnalysis.output.get("PLOT");
pf[2] =
new PlotFrame("Kaplan-Meier Estimate Plot
III", myPlot,
500,
270);
argument.put(DATA_NAMES,
names);
graphicalAnalysis = new SurvivalEstimatePlot(argument,
new double[][] {sortedTime1, sortedTime2},
new double[][] {sortedSurvivalEstimate1,
sortedSurvivalEstimate2}).graphicalAnalysis;
pf[3] =
new PlotFrame("Kaplan-Meier Estimate Plot
IV",
graphicalAnalysis.plot, 500, 270);
new PlotFrameFactory().putPlotFrame(pf);
}
}
Results: